
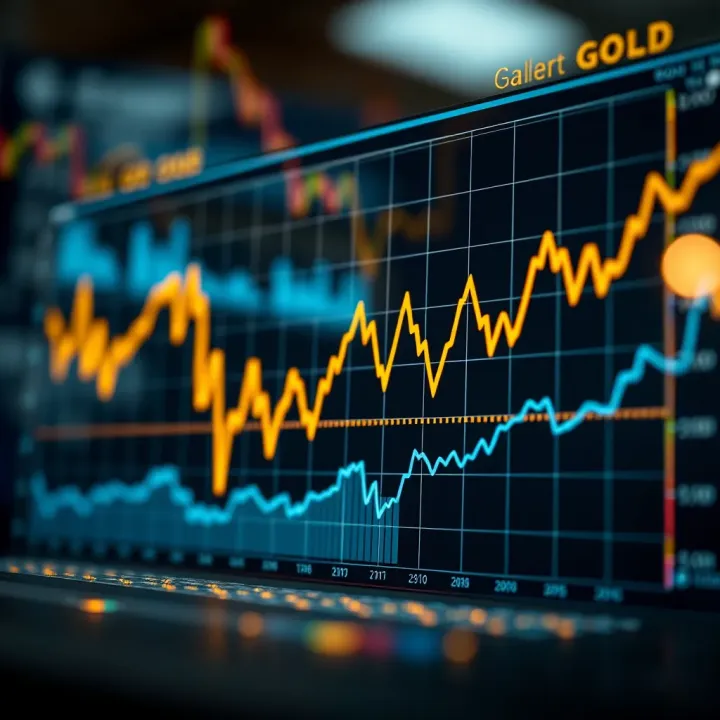
Gold Price Forecast Today: Key Market Insights
📈 Discover how economic signs, global shifts, and local factors shape gold prices today. Get expert tips and forecasts to guide your gold investments wisely in Kenya. 💰
Edited By
Henry Mitchell
Gold, traded against the US dollar as XAU/USD, remains a key marker for financial markets always on the move. Its price today depends on several concrete factors that traders, investors, and financial analysts must grasp to make informed decisions.
A top influence is the performance of the US economy. Indicators like the Consumer Price Index (CPI), employment reports, and Federal Reserve policy announcements directly impact gold prices. For instance, a stronger US dollar generally pushes gold prices lower, as gold becomes more expensive for holders of other currencies, including the Kenyan shilling.

Geopolitical tensions also shift investor sentiment. Conflicts, trade disputes, or unexpected global events can trigger safe-haven demand, driving investors towards gold. For example, recent unrest in key oil-producing regions or changes in US-China trade relations tend to increase gold-buying as a security buffer.
Market trends and technical analysis play a practical role for traders in Kenya and beyond. Monitoring resistance and support levels, as well as moving averages, helps predict short-term gold movements. A drop below a key support line could signal further decline, while breaking above resistance may indicate upward momentum.
Keep in mind, gold does not move alone. It often reacts inversely to stock markets and interest rate shifts. Understanding these relationships can give you an edge in anticipating price swings.
US economic data releases: Expect sharp reactions especially during inflation or employment announcements.
Dollar Index movements: A stronger dollar usually weighs on gold prices.
Geopolitical developments: New headlines can spark quick shifts in gold demand.
Technical patterns: Watch for breakouts or reversals on daily charts.
By following these factors, traders can better anticipate gold price trends, balancing global influences with local market realities such as currency exchange rates and regional investment flows. This awareness supports smarter entry and exit decisions for both short-term trades and longer-term holdings.
Understanding the current state of the XAU/USD market is vital for anyone trading or investing in gold. It sets the groundwork for interpreting factors like price shifts, investor behaviour, and market sentiment. For instance, knowing whether gold prices have recently jumped or dipped can influence when you choose to enter or exit a trade.
Daily and weekly gold price changes offer insight into short-term market dynamics and broader trends. For example, if gold prices have steadily climbed over the last week, it might reflect increased demand due to economic uncertainty, encouraging traders to hold long positions. Conversely, a sudden daily drop could prompt cautious investors to re-evaluate their exposure.
Looking at patterns within gold trading sessions reveals intraday tendencies, such as higher volatility during US market hours or stabilising prices in quieter Asian sessions. These patterns help traders time their trades to exploit periods of increased liquidity or avoid unpredictable swings.
The US dollar's value has a direct impact on XAU/USD prices. Typically, when the dollar weakens, gold becomes cheaper for holders of other currencies, pushing its price up. For instance, if recent policy announcements weaken the dollar, Kenyan investors may see gold prices rise, altering the risk–reward profiles for short-term trading.
Investor risk appetite significantly affects gold demand. During times when investors prefer riskier assets like equities, gold often sees reduced interest. On the other hand, growing concerns about inflation or market instability can boost appetite for gold as a safer store of value.
Gold’s reputation as a safe haven becomes clear during crises or geopolitical tensions when many flock to it to preserve their wealth. For Kenyan investors, this means that in times of local or global uncertainty, tracking safe-haven demand offers useful clues about potential price surges.
Trading volumes and liquidity shape how smoothly gold trades and influence price stability. Higher liquidity, often seen during major market open hours and through platforms like the Nairobi Securities Exchange or global brokers, facilitates better price discovery and narrower spreads. Low volumes can increase volatility, warning investors to proceed cautiously.
Keeping an eye on real-time price moves, understanding session dynamics, and grasping market mood will help you make better decisions in the gold market.
Monitor daily and weekly price changes to spot emerging trends.
Consider timing your trades according to active trading sessions.
Watch US dollar strength, which inversely correlates with gold prices.
Gauge investor sentiment to understand gold’s demand as a safe haven.
Check liquidity levels to avoid unexpected price swings.
This practical overview helps Kenyan traders and investors align their strategies with current market realities, improving their chances for profitable gold trades.

Economic data from the US and beyond plays a significant part in shaping gold prices today. These indicators provide traders and investors with clues about market sentiment, inflation expectations, and financial stability—all of which influence demand for gold as a safe and profitable asset.
Interest rates and Federal Reserve announcements have a direct impact on gold prices. When the Federal Reserve (Fed) signals a rise in interest rates, it tends to push up the value of the US dollar. Since gold is commonly priced in dollars (XAU/USD), a stronger dollar makes gold more expensive for holders of other currencies, often weighing down its price. Conversely, a pause or reduction in rates typically supports gold prices as borrowing costs fall and the dollar weakens. For example, during periods of economic uncertainty, investors eagerly watch Fed statements for hints about monetary policy changes that could shift gold’s trajectory.
Inflation reports and gold as an inflation hedge are closely tied. Gold is often seen as a store of value when inflation climbs, as it tends to retain purchasing power better than cash or some bonds. When inflation data shows rising consumer prices, investors usually turn to gold to preserve wealth. For instance, if the Consumer Price Index (CPI) rises above market expectations, this could trigger increased buying of gold, pushing prices higher. Kenyan investors following inflation trends in the US should keep an eye on how these shifts influence gold prices globally.
Employment figures and their market impact matter because strong job numbers often signal economic recovery, which can lead the Fed to consider tightening policies. Such moves usually strengthen the dollar and put downward pressure on gold. On the other hand, disappointing employment reports may spur gold buying as investors seek safety from economic slowdown risks. A classic example is the US Nonfarm Payrolls report, released monthly, which traders monitor for cues on economic health and potential policy shifts.
Currency trends besides the US dollar also play a role in gold price movements. While gold is priced in USD, shifts in other currencies like the euro, yen, or emerging market currencies influence demand indirectly. For example, if the euro weakens compared to the dollar, European investors might find gold pricier, potentially reducing demand. Additionally, currencies of major gold consumers, such as India and China, also affect local demand and global prices.
Commodity price correlations offer another angle to watch. Gold sometimes moves alongside other commodities like silver or crude oil due to shared economic drivers such as inflation or risk sentiment. However, there are times when they diverge; for example, oil prices rising sharply often spur inflation concerns that favour gold even if oil and gold don’t track perfectly. Kenyan traders should note these dynamics, especially when tracking commodities traded on regional exchanges or influenced by East African trade.
Economic performance of key countries influences gold prices by shaping global risk appetite and currency stability. Economies like China, India, and Germany are important because their import demand for gold can shift prices. When economic growth slows in these countries, demand for gold jewellery, investment bars, or coins may drop, weighing down global prices. Conversely, strong growth can bolster demand and raise prices. For instance, slowdowns in Chinese industrial output or Indian imports often send ripples through gold markets worldwide.
Economic indicators provide a roadmap for understanding gold price movements. Keeping an eye on these data points helps you anticipate shifts in gold’s value and plan your trading accordingly.
Overall, tracking US economic signals alongside global factors provides a comprehensive view that Kenyan traders can use to make informed decisions about gold investment today.
Geopolitical events often move gold prices more than many realise, making them crucial for anyone tracking XAU/USD today. When tensions rise between countries or new trade barriers emerge, gold tends to react sharply. Understanding these links helps investors and traders make sense of sudden price changes and position themselves better in volatile markets.
Crises usually increase gold's appeal as a safe haven because investors rush to secure assets that hold value when uncertainty spikes. For example, when conflicts erupt or geopolitical risks heighten—like border disputes or sanctions—investors typically scale back riskier assets such as stocks. Instead, they turn to gold, pushing its price up. This behaviour reflects gold's historical role as a store of value when currencies or markets face stress.
Recent events show how this works in practice. The ongoing tensions in Eastern Europe and Middle East flare-ups have led gold prices to edge higher as investors hedge against possible disruptions. Even smaller scale conflicts prompt sharp but shorter-lived gold rallies, giving traders clues about risk sentiment. For Kenyan investors keeping an eye on XAU/USD, these episodes offer both opportunities and warnings.
Trade disputes and tariffs directly affect gold by influencing currency strength and commodity flows. When countries slap tariffs or threaten trade wars, market confidence can dip, triggering a flight to gold. The US-China trade tensions a few years back, for instance, sent gold prices north as uncertainty over economic growth increased. Such disputes impact gold demand through their effect on global trade and manufacturing, which ultimately shape currency strength and inflation expectations.
New regulations shaping gold markets also play a role. Changes in import-export rules, tax treatments on precious metals, or stricter anti-money laundering laws can alter trading volumes and investor appetite. For example, regulations that facilitate easier gold trading or ownership tend to boost demand, stabilising prices. Conversely, tighter rules or increased taxes may discourage buying, leading to price corrections.
Central banks remain significant players in gold markets through their buying and reserve management. When central banks, especially from emerging economies like India or China, increase gold purchases, it signals confidence in gold's long-term value and may push prices up. Kenya's own Central Bank occasionally adjusts reserves for diversification, which can have localized market effects.
Central bank activity often reflects strategic economic priorities and geopolitical positioning, adding an extra layer for traders to monitor alongside market data.
In summary, geopolitical risks and policy decisions continuously influence gold prices. Keeping track of developments in these areas offers practical insights that complement economic and technical analysis for anyone engaged with the XAU/USD market today.
Technical analysis plays a vital role in understanding short-term price movements in the XAU/USD market. By using charts and past price data, traders and investors can spot patterns that hint at future direction without relying solely on news or economic indicators. This hands-on approach helps make timely decisions, especially in a market as reactive as gold often is.
Support and resistance are the basic building blocks in technical analysis. Support refers to the price level where buying interest tends to outweigh selling pressure, creating a "floor" beneath the current price. For example, if gold repeatedly bounces back after falling to around $1,900 per ounce, that level becomes a key support. Identifying this floor helps traders plan entry points to buy with a clearer stop-loss level.
Resistance works the opposite way, acting as a "ceiling" where selling pressure increases, preventing prices from rising further. If gold struggles to move beyond $1,950 an ounce during several attempts, traders consider this price a significant resistance. Knowing these levels allows better timing for exits or short selling.
Recent market activity sometimes breaks through these zones. Breakouts occur when the price breaches resistance on higher volume, signalling momentum that might carry prices higher. For instance, a sudden surge past $1,950 with growing trade volumes could mean a bullish run. On the flip side, reversals happen when price fails to break through resistance or support and changes direction sharply, often catching traders off guard.
Moving averages smooth out daily price fluctuations to reveal trends over time. Popular ones include the 50-day and 200-day moving averages. A crossover, when a short-term moving average crosses above a longer-term one, often indicates a buy signal. For example, if the 50-day average crosses above the 200-day, it hints at upward momentum, encouraging traders to consider long positions.
The Relative Strength Index (RSI) measures momentum by tracking how fast and how far prices move. RSI ranges from 0 to 100; readings above 70 suggest overbought conditions, signalling a possible price correction, while below 30 points to oversold scenarios, often implying a buying opportunity. If gold shows RSI near 75, traders might prepare for a pullback even if prices are still rising.
Volume trends help confirm price moves. When price breaks key levels on high volume, it suggests genuine interest rather than a false move. For example, a breakout above resistance with increased trading volume shows strong conviction among market participants. Conversely, low volume breakouts tend to fade, warning traders to be cautious.
Accurate chart reading combines these technical tools, offering practical guidance about potential price paths. For traders in Kenya, such insights help navigate volatility and take advantage of price moves in XAU/USD more confidently.
Understanding how to navigate the XAU/USD market requires more than just following global price movements. For Kenyan traders and investors, practical guidance that considers both international gold trends and local factors is vital. This section highlights ways to use gold price predictions effectively, manage risks, and take advantage of market opportunities within Kenya’s unique financial environment.
Combining fundamental and technical analysis gives traders a fuller picture of gold’s price behaviour. Fundamental analysis looks at economic indicators like US inflation data or Federal Reserve rate decisions, which affect gold's appeal. On the other hand, technical analysis studies charts and price patterns to signal entry or exit points. By merging these methods, Kenyan investors can avoid relying solely on one approach and instead make more balanced decisions. For example, buying gold when technical indicators show a support level holds and when inflation data points to rising prices can improve timing and results.
Risk management is a key part of successful trading. Gold’s price can swing sharply due to sudden changes in the US dollar or global events. Kenyan investors should never risk more than a small portion of their capital on a single trade. Using stop-loss orders helps limit losses if the market moves unfavourably. Additionally, diversifying investments across different asset classes or gold forms—such as ETFs, physical bars, or mining stocks—can reduce exposure. This way, if one asset class dips, others may balance the portfolio.
Knowing when to enter or exit positions is critical. Many traders wait for confirmation signals like a strong breakout above resistance or a reversal near a support level before deciding. In Kenya, monitoring real-time news and market updates helps traders react quickly. For instance, a sudden easing of US interest rates might prompt a quick buy, while rising rates could signal it’s time to take profit. Timing also depends on individual goals—short-term traders may act differently than those investing for wealth preservation.
Kenyan investors benefit from increased access to gold investment platforms thanks to fintech growth. Apps and online brokers allow easy buying and selling of gold with minimal costs. However, not all platforms offer the same features; some provide live charting and analysis tools which help in making informed decisions. Using local payment options like M-Pesa streamlines transactions, making gold trading accessible even outside Nairobi’s financial centres.
The Kenyan Shilling exchange rate plays a significant role in gold investment decisions. When the shilling weakens against the US dollar, imported gold prices tend to rise locally, affecting both physical gold buyers and investors in US dollar-denominated contracts. Keeping an eye on CBK announcements and forex trends helps traders anticipate these movements. For example, if the shilling depreciates sharply, local investors might choose to hold gold as a hedge against currency risks.
Navigating Kenya’s regulatory environment is another important consideration. Commodity trading regulations can vary between counties, and investors should verify licences and compliance of brokers or platforms before committing funds. Additionally, familiarity with taxation policies related to capital gains on gold investments ensures that returns are not unexpectedly diminished. Staying updated with guidance from bodies like the Capital Markets Authority (CMA) prevents legal or financial setbacks.
Practical success in gold trading in Kenya stems from blending global market insights with clear understanding of local conditions, strong risk controls, and use of appropriate tools.
By focusing on these practical steps, Kenyan traders and investors can improve their readiness to benefit from daily XAU/USD price movements and make better choices in the gold market.
📈 Discover how economic signs, global shifts, and local factors shape gold prices today. Get expert tips and forecasts to guide your gold investments wisely in Kenya. 💰
📈 Discover key factors driving Cardano's price, recent trends, and expert analysis on future movements, tailored for Kenya's crypto investors.

📈 Explore Bitcoin price prediction by examining market trends, tech changes, and regulations. Get insights and risks for smarter investment choices in Kenya.

📊 Explore Bitcoin price trends in USD with insights on market demand, regulations, tech, and forecasts. Stay informed before investing in Kenya’s crypto market!
Based on 14 reviews