
Guide to Using DerivTradingView for Market Analysis
📈 Discover how DerivTradingView blends Deriv’s platform with TradingView’s charts to boost your market analysis and trading in Kenya. Learn features, costs & tips!
Edited By
Hannah Wood
TradingView charts have become a reliable tool for traders and investors across Kenya looking to make informed decisions in volatile markets. Unlike simple price lists, TradingView offers detailed visual data that helps you spot trends, patterns, and turning points easily. Whether you’re analysing equities on the Nairobi Securities Exchange (NSE), foreign exchange pairs, or local commodities, these charts provide crucial insights.
What sets TradingView apart is its user-friendly interface combined with powerful features tailored for deep market analysis. Kenyan traders can customise charts by choosing from various types such as candlestick, line, and bar charts depending on their strategy and preference. This flexibility allows you to monitor price movements, volume, and other indicators that matter most to your trading style.
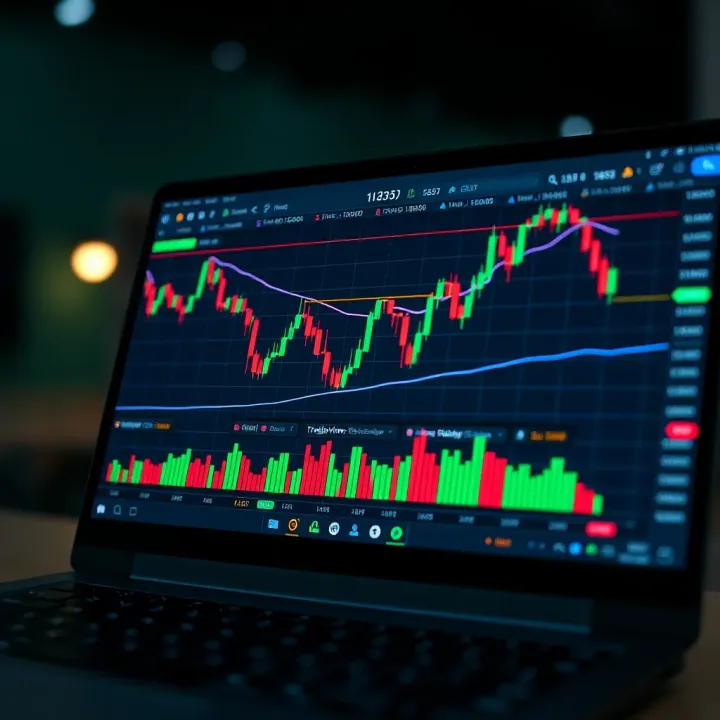
Getting your charts set up correctly is half the battle won when it comes to effective market analysis.
Key advantages of using TradingView charts include:
Customisable timeframes: Choose intervals from one minute to monthly views to capture short-term trades or long-term investments.
Technical indicators: Apply tools like Relative Strength Index (RSI), Moving Averages (MA), and Bollinger Bands to better understand market momentum and volatility.
Drawing tools: Mark support and resistance levels, trendlines, and Fibonacci retracements directly on your chart for clearer visual guidance.
With its cloud-based nature, TradingView allows you to save chart layouts and access them seamlessly across devices—a big plus for traders who move between office and home. Additionally, alerts can be set to notify you via SMS or email when key price levels are hit, enabling timely reactions without constantly watching the screen.
Setting up a chart on TradingView is straightforward. Start by searching for the asset you want to analyse, then select the desired chart type and timeframe. From there, add indicators and drawings to fit your analysis style. For example, if tracking Safaricom shares on the NSE, you might combine 50-day and 200-day moving averages to spot potential buy or sell signals.
In summary, TradingView charts equip Kenyan traders and investors with a comprehensive view of market dynamics. Mastering these tools helps reduce guesswork and improves the timing of your trades—skills valuable for anyone active in today’s fast-moving markets.
TradingView charts have grown significantly in popularity thanks to their ease of use and comprehensive features that cater to beginners and seasoned traders alike. For anyone involved in trading or market analysis in Kenya, understanding these charts is a solid starting point to making smarter decisions. They offer a visually rich and data-driven platform where you can observe price movements, spot trends, and time your trades better.
TradingView provides real-time market data, which means you get updates instantly as market prices change. This feature is key for traders who rely on fast decision-making, especially in markets like forex or cryptocurrencies where prices can swing in seconds. For example, a forex trader in Nairobi watching the USD/KES pair can track live bids and asks and adjust positions before price movements eat into profits or stop losses.
Real-time data also ensures your analysis isn’t based on outdated numbers. This immediacy helps when placing trades through linked brokers or when monitoring volatile sectors such as energy or tech stocks.
The interactive interface on TradingView is designed for active engagement. You can zoom in on specific timeframes, draw trend lines, and switch between chart types with a click. This hands-on approach lets traders explore different strategies and scenarios quickly without toggling between several platforms.
Take, for instance, a commodities trader studying gold prices. They can draw Fibonacci retracements directly on the chart or annotate breakout points before the market opens in Kenya. The interactive nature accelerates spotting important signals and sharing insights with colleagues or clients.
TradingView covers a wide range of financial instruments, which means you’re not limited to one asset class. Whether you’re tracking NSE stocks, major forex pairs, or Bitcoin, you can find nearly everything under one roof. This helps Kenyan investors diversify their portfolios and manage risk across markets easily.
Being able to monitor various instruments on one platform is especially useful for hybrid traders who might combine equities with forex positions. A trader can follow Safaricom shares and EUR/USD simultaneously, adjusting their strategy as events unfold.
TradingView supports stocks from major global exchanges, including the Nairobi Securities Exchange (NSE), allowing direct analysis of local blue-chip companies like Equity Bank or KCB Group. It also includes indices such as NSE 20, which summarises market performance, helping you see the bigger picture quickly.
For Kenyan investors, assessing stocks side by side with global markets like the S&P 500 or FTSE 100 offers insights into how international trends might influence local equities. This comparative analysis can guide smarter entry or exit points.
Forex and cryptocurrencies feature prominently due to their high liquidity and 24/7 trading hours. On TradingView, you can access real-time charts for major forex pairs like USD/KES and crypto coins such as Bitcoin and Ethereum.
This is vital for active traders in Nairobi, especially those using margin or swing trading techniques. For example, monitoring crypto volatility on TradingView helps avoid surprises when global markets react rapidly to news.
Commodities like gold, oil, and coffee, along with their futures contracts, are readily available on TradingView. This is relevant for Kenyan traders who follow agricultural markets or energy prices affecting fuel costs at the pump.
You can study commodity price cycles, chart key support and resistance levels, and prepare for seasons where prices traditionally rise or fall. Futures data, especially, provides a chance to anticipate market moves before spot prices shift.
TradingView’s broad market coverage and practical tools make it a one-stop platform. Whether analysing your favourite NSE stock or keeping an eye on forex pairs, using these charts effectively can sharpen your trading game.
Choosing the right type of chart on TradingView helps you spot market trends and make better decisions. Different chart styles offer unique views of price movements, so understanding each improves your ability to interpret market behaviour accurately.
Candlestick charts are the most popular among traders. They display price action using "candles" that show open, high, low, and close prices for a chosen time period. This helps you quickly see whether buyers or sellers controlled the market during that time. For example, a green candle usually means prices went up, while red shows decline. Candlestick patterns like 'doji' or 'hammer' can signal reversals or continuation, which is handy for entry or exit points.
Line charts simply connect closing prices over a period with a continuous line. While less detailed than candlesticks, line charts offer a clean view of overall price trends without the noise of intraday fluctuations. These are practical for spotting long-term trends or for investors interested in the general direction of a stock, say Safaricom shares over several months, rather than short-term swings.
Bar charts resemble candlesticks but use vertical lines with ticks on either side indicating opening and closing prices. They provide detailed price information similar to candlesticks but can be easier to interpret for some traders when analysing volume or volatility patterns. Bar charts are useful when studying specific market moves, allowing clear visibility of price ranges, which helps in volatile markets like forex.
Heikin Ashi charts smooth out price data by averaging values, helping reduce market noise and revealing clearer trends. Traders use them to hold positions longer or avoid whipsaws common in standard candlestick charts. In Kenya’s sometimes choppy stock market, Heikin Ashi can highlight sustained moves more effectively.
Renko charts focus exclusively on price movement rather than time, building 'bricks' only when price moves a set amount. This filters out insignificant changes and reveals strong trends or breakouts. Renko is especially useful in markets with sideways movement, like some commodities, making it easier to identify genuine trend reversals.
Point and Figure charts ignore time and volume altogether, plotting price changes only when they cross predetermined thresholds. This makes them excellent for spotting support and resistance levels without the distraction of minor price fluctuations. Traders dealing with NSE stocks or forex pairs often use this method to detect clear buy or sell signals in noisy markets.
Each chart type offers a different lens on market behaviour. Using the right style on TradingView can sharpen your analysis and boost confidence whether you trade stocks, forex, or commodities.
Customising TradingView charts shapes how effectively you can analyse market movements. Tailoring charts to fit your trading style and market focus sharpens insights and decision-making. For instance, a day trader needs different chart settings than a long-term investor. Without proper customisation, you risk missing important signals or cluttering your view with unnecessary data.
Choosing the right time frame depends on your trading or investing approach. Short-term views, like 1-minute or 5-minute intervals, suit active traders following intraday price swings. These give quick real-time snapshots but can be noisy. Long-term views, such as weekly or monthly charts, help investors spot broader trends and plan over months or years. For example, a Kenyan investor tracking Safaricom shares may use monthly charts to understand yearly growth patterns.
TradingView supports a wide range of intervals, from intraday to monthly. Intraday intervals (e.g., 15-minute or hourly) allow close monitoring during market hours, useful if you want to trade forex or NSE (Nairobi Securities Exchange) stocks actively. Monthly intervals help look past daily noise and focus on macroeconomic influences. Switching between these intervals is as easy as a click, enabling you to zoom in for detail or zoom out for big-picture trend confirmation.
Popular technical indicators like Relative Strength Index (RSI), Moving Average Convergence Divergence (MACD), and Bollinger Bands provide clues about momentum, potential reversals, or volatility. For instance, RSI can help you spot overbought conditions in cryptocurrencies like Bitcoin. Using these indicators alongside price action improves your analysis by confirming signals or warning of weakness.
Drawing trend lines and support/resistance levels are key for identifying price boundaries and likely reversal points. You might draw a trend line linking lows on an Equity Group share to track its uptrend. Support and resistance lines show where price historically bounces or stalls, helping you set entry or exit points.
Adding moving averages and oscillators smooths price data to reveal underlying trends and cycles. A 50-day moving average is popular for its balance between short and medium-term trends. Oscillators, like Stochastic, identify momentum shifts, helping Kenyan traders time entries or exits, especially in volatile forex pairs like USD/KES.
Changing colours and themes helps reduce eye strain and makes patterns stand out. Dark mode themes are popular for trading late into the night, while some prefer bright backgrounds to mimic daylight. By choosing colour schemes that highlight bullish or bearish candles distinctly, you get quicker visual cues.
Organising chart layouts lets you monitor multiple instruments or timeframes simultaneously. For example, arranging side-by-side charts for NSE stocks and forex pairs helps you spot correlations or divergences. This setup suits brokers and analysts who manage diverse portfolios.
Saving chart templates avoids repeating the same customisations. Once you configure your preferred indicators, colours, and layouts, save the template. Next time, just load it to jump straight into analysis without starting from scratch, boosting efficiency for daily trading routines.
Customising TradingView charts to your needs is not a luxury; it's a necessity for clearer, faster market decisions. Whether adjusting time frames, applying indicators, or tweaking appearance, every detail counts for Kenyan traders aiming to stay ahead.
TradingView offers a suite of practical tools that bring market analysis within easy reach for traders and investors. Whether you are tracking stocks on the Nairobi Securities Exchange (NSE) or forex pairs like USD/KES, these features help you spot trends quicker, mark key price points, and stay ahead of market moves.
Trend lines and channels are essential for visualising market direction. Drawing a trend line along the highs or lows highlights the momentum and potential reversal areas. Channels add parallel boundaries, showing where prices might find support or resistance. For example, if Safaricom shares keep bouncing between two trend lines, it signals a trading range where you can plan your entries and exits.
Fibonacci retracements help you identify possible levels where a price pullback might end and the original trend may resume. These levels, based on ratios like 38.2%, 50%, and 61.8%, act as psychological support or resistance zones. Kenyan traders often apply it to forex charts, say, USD/KES, to anticipate correction depths after sharp moves, making it a handy tool for timing trades.
Text notes and shapes let you add contextual remarks or highlight chart patterns directly on your TradingView charts. This could mean marking upcoming Kenya Revenue Authority (KRA) reporting dates or drawing circles around key breakout points. These visual reminders enhance your market study and make reviewing past analyses easier.
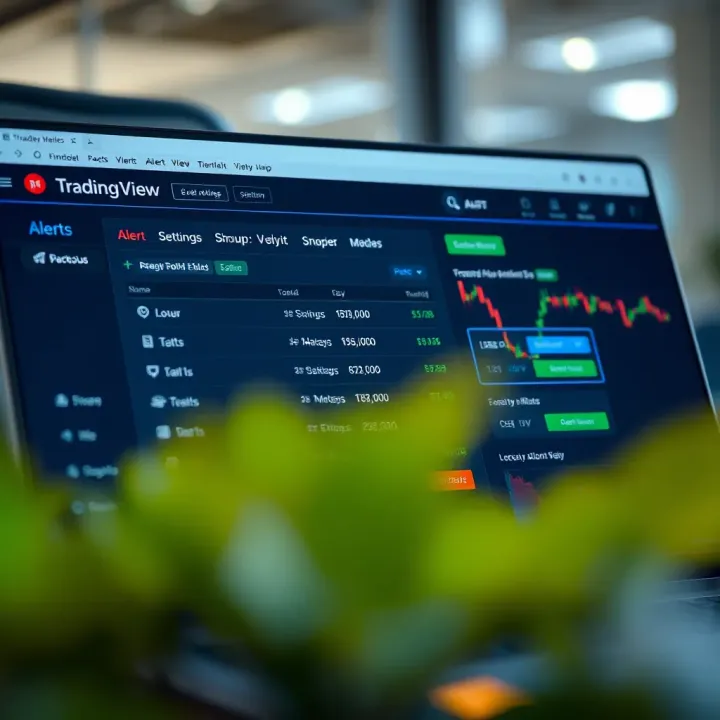
Setting up price alerts is vital for busy traders who cannot watch the charts 24/7. Alerts notify you when an asset hits a specified price — say, when KCB Group shares cross KSh 40. This way, you don't miss important moves and can act fast, either through your broker's platform or via TradingView's integrated features.
Using stock and forex screeners helps narrow down choices from thousands of instruments. These screeners filter based on criteria like volume, price change, or technical indicators. For instance, if you're keen on NSE stocks showing strong momentum in the last week, you can set up a screener to list those outperformers, saving time and focusing your watchlist.
Custom alert conditions allow for more advanced notifications. Beyond simple price points, you can set alerts for indicator crossovers, volume surges, or custom formulae tailored to your strategy. Imagine receiving a notification when the Relative Strength Index (RSI) on Equity Bank hits below 30, signalling a potential oversold condition — that is the kind of edge these alerts offer.
Leveraging TradingView’s drawing tools and alerts can significantly improve your market timing and precision. These features support a disciplined approach, helping you make decisions backed by clear visual cues and real-time notifications.
In summary, mastering these tools means you can better organise your analysis, act swiftly on signals, and keep track of multiple markets without getting lost or overwhelmed. For Kenyan traders, especially those juggling full-time jobs or other commitments, TradingView’s functionalities provide a solid foundation to trade smarter, not harder.
Integrating TradingView charts with your trading system streamlines your analysis and execution, making it easier to act swiftly on market opportunities. For Kenyan traders and investors who rely on fast, accurate information, linking TradingView directly with broker accounts or other platforms reduces delays and minimises errors that can come from switching between apps.
TradingView supports linking with various brokers, both locally and internationally, enhancing convenience for traders in Kenya. Brokers like FXPesa, which are popular for forex and CFD trading in Kenya, offer compatibility with TradingView. International brokers such as Interactive Brokers and OANDA also connect, allowing broader market access. This connection means traders don’t have to manually transfer signals or data between platforms.
Being able to place trades directly from TradingView charts cuts out several steps. Instead of analysing on one system and trading on another, you can execute buys or sells from the same interface. This is vital in markets that move quickly, such as forex or cryptocurrencies. For example, when a currency pair breaks a key resistance on the chart, a trader can immediately enter a position without missing the move.
Embedding TradingView charts on websites is useful for analysts and financial bloggers who want to share live or latest market trends. For instance, a Kenyan investment educator can add interactive charts to their site, helping readers follow NBO Securities or NSE 20 index movements without needing to leave the page.
Sharing analysis on social media builds your presence and connects you with other traders. TradingView allows easy sharing of annotated charts on platforms like Twitter or LinkedIn. Many Kenyan traders use this to showcase setups in forex pairs like USD/KES or commodities like tea prices, sparking discussions and learning.
The TradingView mobile app keeps you connected when away from your desk. With live updates, alerts, and charting tools on your phone, you can manage trades and monitor markets on the go. This is especially helpful for Kenyan traders who travel frequently or rely on matatu commutes — they can catch sudden market changes during transit.
Integrating your TradingView charts with brokerage accounts and other platforms boosts your trading efficiency and responsiveness, which can make all the difference in fast-moving markets.
📈 Discover how DerivTradingView blends Deriv’s platform with TradingView’s charts to boost your market analysis and trading in Kenya. Learn features, costs & tips!
📈 Learn how to add TradingView charts on Deriv for clearer market insights. Step-by-step tips help Kenyan traders boost strategies and navigate tech setup easily.
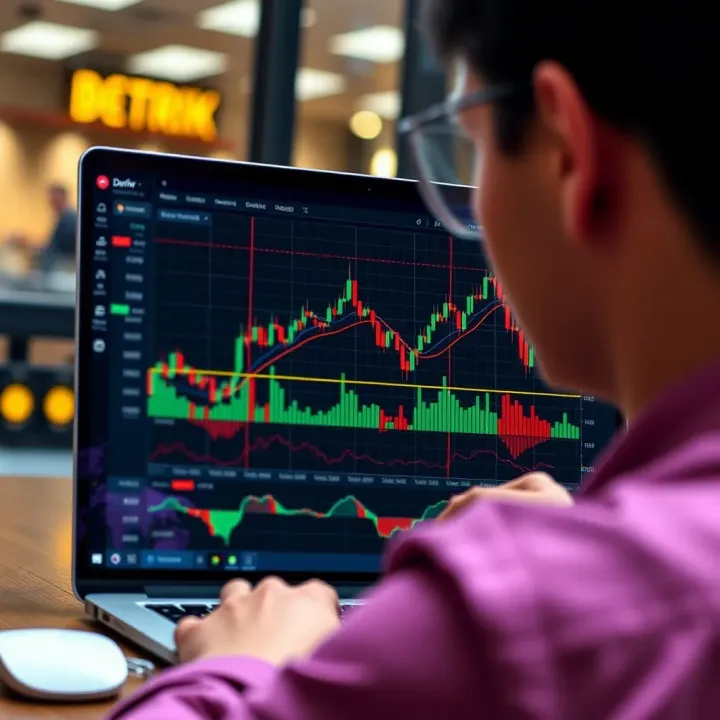
📊 Learn how to integrate TradingView charts on the Deriv platform to sharpen your market analysis and boost trading performance in Kenya's dynamic market environment.
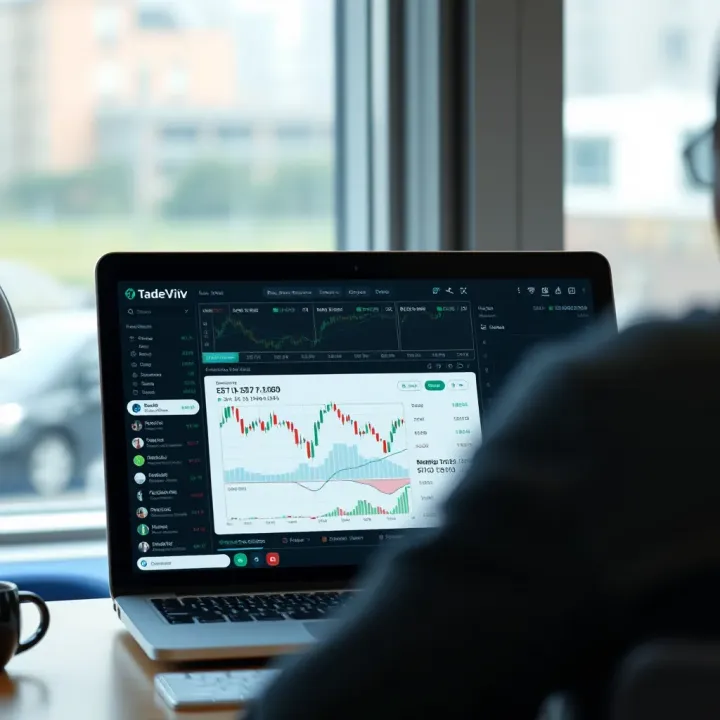
📈 Discover how Kenyan traders can seamlessly combine Deriv and TradingView for smarter trades. Learn setup tips, strategies, and solutions for smooth trading.
Based on 5 reviews