
Using TradingView Charts for Market Analysis
📊 Master TradingView charts for smarter market moves. Learn to customise, analyse and set alerts tailored for Kenyan traders and investors. Boost your trading skills now!
Edited By
Richard Dawson
TradingView charts have become a must-have tool for traders and investors looking to make better decisions in the financial markets. Whether you are dealing with equities, forex, or cryptocurrencies, TradingView gives you access to detailed charts with a wide range of features that help you spot trends, identify entry and exit points, and manage risks effectively.
Setting up TradingView is fairly straightforward. Once you open the platform, you can choose from various chart types such as candlestick, line, or bar charts depending on your preference. The candlestick chart is especially popular among Kenyan traders because it displays price action clearly and helps visualise market sentiment.
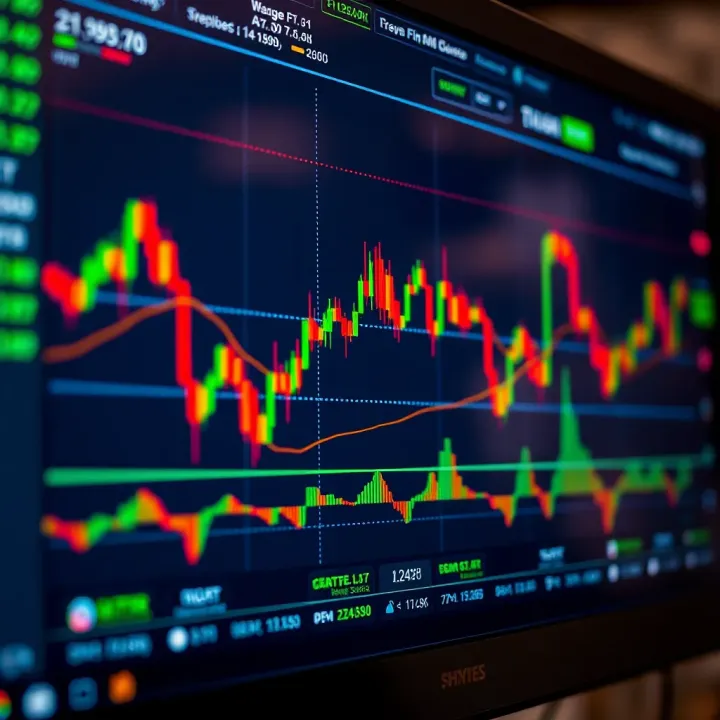
Customising charts to fit your trading style is essential. You can add technical indicators like Moving Averages (MA), Relative Strength Index (RSI), and Bollinger Bands directly on the chart. For example, a 50-day MA helps reveal the overall trend direction, while the RSI can indicate if a stock or currency is oversold or overbought.
Remember, no single indicator tells the whole story; combining several helps reduce false signals.
In addition to indicators, TradingView allows drawing tools such as trendlines, Fibonacci retracements, and support/resistance zones. Drawing a trendline connecting the lows during an upward move can help you identify when the trend might be weakening.
For Kenyan traders, integrating real-time market data on TradingView with mobile access through Safaricom's internet or other providers means you can check charts anywhere, even during your daily matatu commute. You can also set alerts on price levels or indicator values so that you receive notifications on your mobile without staring at the screen all day.
To get the most from TradingView:
Start with simple indicators before layering complex ones.
Use multiple time frames (e.g., daily and 1-hour charts) to get a clearer picture.
Regularly save your chart layouts and notes for future reference.
Explore community scripts developed by other traders for fresh ideas.
Understanding these basics will help you exploit TradingView’s power for precise market analysis and smarter trading decisions tailored to Kenya’s dynamic markets.
Starting with TradingView charts is the foundation for effective market analysis. Before diving into technical indicators and complex strategies, you must be comfortable navigating the platform and understanding its core features. This step saves time and prevents confusion when analysing live markets or backtesting trades.
To begin, sign up for a free TradingView account using your email or social media. The free version grants access to essential charting tools, which is enough for most beginners and many intermediate traders. Once logged in, you can find charts by searching for assets using the search bar at the top. For example, if you want to analyse Kenya’s NSE 20 share index or Safaricom shares, type the ticker symbol directly to open its chart.
TradingView’s interface is user-friendly but packed with features that may overwhelm new users. The main chart area shows price action, while toolbars around the edges provide access to drawing tools, technical indicators, and settings. The watchlist lets you track several assets at once, essential for active traders juggling multiple markets. Also, the timeline at the bottom enables quick shifts through different timeframes—from minutes to months. For instance, Kenyan traders can switch between a 5-minute chart for day trades and a daily view for longer-term investments easily.
Choosing what to watch is a critical first step. TradingView covers thousands of global assets, including equities, forex, commodities, and cryptocurrencies. Kenyan traders often combine local markets like NSE with global ones such as US stocks or forex pairs like USD/KES. Start with assets you understand well, and gradually explore others to diversify your portfolio. Pay attention to market hours as well—for example, NSE trading runs from 9:30 am to 3 pm EAT, affecting liquidity and volatility.
Familiarising yourself with the basics of TradingView charts sets you ahead—it lets you focus on analysing market moves instead of fumbling with tools when key moments hit.
Getting these steps right helps you use TradingView in a way that suits your trading style and goals. It is not just about knowing what the prices say, but also how to access and interpret them effectively.
Customising your chart layout on TradingView is essential to get the most out of your market analysis. By tailoring charts to fit your trading style and focus, you save time and reduce noise, making it easier to spot real opportunities. Whether you trade short-term on the Nairobi Securities Exchange or follow forex markets, a well-set chart layout can improve your decision-making significantly.
Choosing the right chart type influences how you read price movements. For example, candlestick charts are popular for showing open, close, high, and low prices clearly, which Kenyan traders often use when following volatile stocks like Safaricom or equity ETFs. Alternatively, line charts give a clean overview for long-term trends, useful if you’re tracking government bonds.
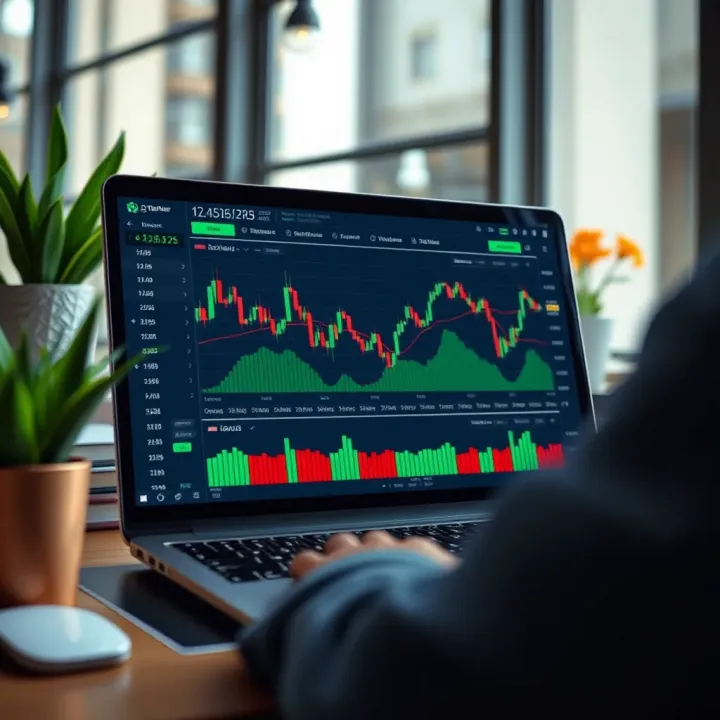
Timeframe selection is just as important. Day traders often prefer 5-minute or 15-minute charts to catch small price swings, while investors might use daily or weekly charts to observe broader market direction. If you watch agricultural commodity prices like maize or tea, zooming in to hourly charts during peak trading hours can reveal short-term supply-demand shifts.
Adjusting colours reduces eye strain during long charting sessions and helps differentiate market phases visually. You can switch to a dark theme, which many prefer for late-night analysis, or a light theme better suited to daytime use. You might colour bullish candles green and bearish ones red for clarity, or reverse these colours for personal preference.
Besides colours, chart styles like bar charts, hollow candles, or Heikin-Ashi offer alternative ways to spot trends and reversals. For instance, Heikin-Ashi smooths out price noise and can be helpful in choppy markets common in forex pairs involving the Kenyan shilling.
Once you’ve customised charts to your liking, saving layouts is crucial. This lets you quickly switch between setups tailored for different assets or strategies without redoing settings each time. For example, you could have one layout for NSE equities, another for forex pairs like USD/KES, and a third for cryptocurrency if that’s part of your portfolio.
Manage your saved layouts by naming them clearly—e.g., "NSE Daytrade" or "Forex Swing"—so you grab the right one fast. Additionally, TradingView allows you to access these saved layouts across devices, meaning you can analyse markets on your laptop and continue on the mobile app without missing a beat.
Customising charts is not just about looks; it’s about setting yourself up to read markets faster and make smarter calls, especially in dynamic environments like Kenya's financial markets.
Saavy traders know that a neat, personalised chart layout reduces confusion and cut out the unnecessary noise that’s so common when following several markets. This approach means more time focusing on the right signals and less time fumbling through settings every morning.
Indicators and drawing tools are essential for anyone serious about market analysis on TradingView. They help you make sense of price movements, spot trends early, and decide when to enter or exit trades. Without these, charts are just lines that don’t tell the full story.
Some indicators are favourites because they provide clear, actionable signals. Take the Relative Strength Index (RSI): it shows when a stock or currency might be overbought or oversold. For instance, if the RSI crosses above 70, it could signal the market is overheated, and a price drop might follow – a handy tip for forex traders dealing with volatile pairs like USD/KES.
Another popular tool is the Moving Average (MA). Simple Moving Averages (SMA) smooth out price data to reveal trends. Kenyan retail investors often watch the 50-day and 200-day SMA crossovers. When the 50-day crosses above the 200-day, it’s often called a 'golden cross' – a bullish sign suggesting upward momentum.
Also, the MACD (Moving Average Convergence Divergence) helps identify shifts in momentum by comparing two moving averages. It’s quite useful for short-term trading or when dealing with NSE-listed stocks that can be choppy.
Drawing trendlines helps you connect price points to see overall movement direction. Imagine you’re tracking Safaricom shares; drawing an upward trendline beneath major dips helps you understand whether the stock is maintaining strength or weakening.
Support and resistance levels are key price points where the market has previously reversed or stalled. These levels can act as barriers. If a share price hits a strong support around KSh 30 and bounces back, you know buyers are active there. Conversely, resistance near KSh 40 might stop the price from rising unless demand pushes it through.
These tools work best when combined. Trendlines can show the overall price direction while support/resistance pinpoints likely reversal zones, improving trade timing.
Adding annotations lets you jot down observations directly on TradingView charts. You might mark why you bought a certain stock or set a note to watch a price level closely.
Alerts are extremely useful for Kenyan traders who might not monitor charts constantly. For instance, you can set an alert to notify you when KCB Bank’s share price drops below a certain KSh threshold, so you don’t miss a buying opportunity.
Marking trades on your chart also helps review performance later. It creates a visual trading diary, showing where profits or losses happened and what the conditions were at that time.
Using TradingView’s indicators combined with drawing tools and alerts equips you with a clearer market picture. This helps in making informed decisions amid Nairobi’s fast-moving markets and beyond.
By regularly exploring these features, you’ll develop a sharper eye for market trends and improve the timing and success of your trades.
Incorporating TradingView into your daily trading setup helps Kenyan traders make faster, smarter decisions. This platform bridges global market insights with local trading realities, offering tools that align well with Kenyan brokers and the unique pace of our markets. It’s not just about charts; it’s about tailoring those charts to your trading style, managing risk carefully, and staying connected on the move.
TradingView works hand-in-hand with several brokers operating in Kenya, such as KCB Securities, EABL Capital, and local branches of global brokers like Interactive Brokers. Synchronising your TradingView charts with these brokers allows you to monitor live prices and even place trades directly when supported. This direct integration streamlines your workflow, eliminating the need to switch between different platforms.
For example, if you trade NSE equities, you can track price changes on TradingView charts while executing trades through your preferred broker’s platform. This dual setup helps spot entry points more quickly, especially for volatile counters like Safaricom or Equity Bank shares. That said, always confirm the broker supports TradingView integration, as some local brokers may have limited digital interfaces.
TradingView offers numerous indicators and drawing tools — but managing risk requires more than just signals. Kenyan markets can swing sharply, so set clear stop-loss levels using trendlines or support zones marked on your charts. Avoid overloading charts with too many indicators; a cluttered view may hide important warnings.
Also, practise position sizing based on your capital and risk appetite. For instance, risking no more than 2-3% of your trading capital on a single position is sensible. Incorporate alerts on TradingView that notify you when prices hit critical levels, allowing timely adjustments to your trades.
Good risk management is the backbone of profitable trading — charts help, but discipline keeps you afloat.
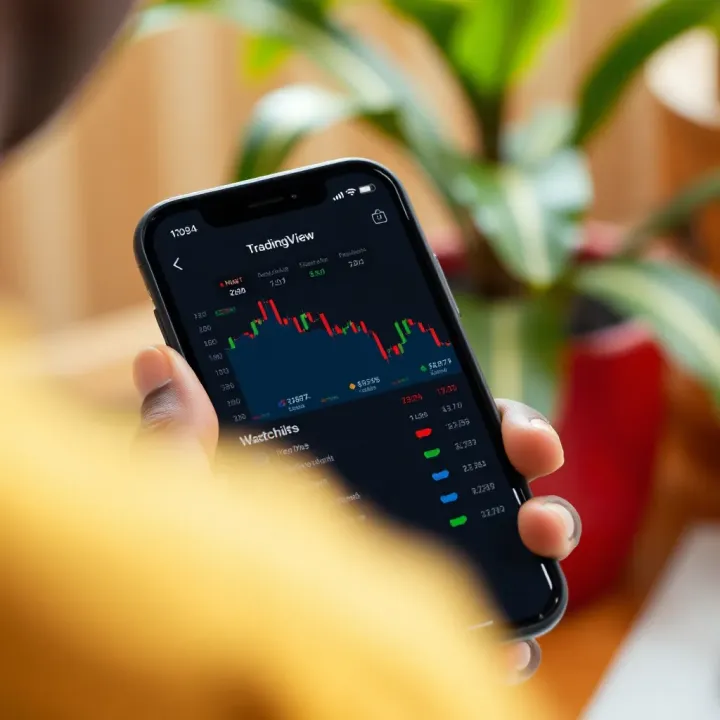
Many Kenyan traders rely heavily on mobile devices due to dynamic lifestyles and sometimes unstable power or internet. TradingView’s mobile app lets you access real-time charts and set alerts without being glued to a computer. It offers a clean interface to follow key markets like Forex pairs (USD/KES, EUR/KES) or commodity prices that impact local businesses.
To make the most of mobile, customise your chart layout for smaller screens—select fewer indicators, use clear colour contrasts, and save frequently used templates. Also, consider activating offline alerts where possible, so important notifications reach you even with intermittent data. This approach ensures you won’t miss crucial market moves, whether in Nairobi traffic or during a weekend farm visit.
Integrating TradingView into your trading routine, especially with Kenya-specific adjustments, sharpens your market awareness and helps you trade from anywhere with confidence.
Using TradingView charts effectively means not only understanding its many features but also recognising the typical hurdles traders face. Many Kenyan traders encounter issues like indicator overload, market noise caused by volatility, and the challenge of keeping up with ever-evolving tools. Addressing these challenges helps you make clearer decisions and avoid costly mistakes.
It’s tempting to pile on every indicator you come across, thinking more data means smarter trades. Yet, too many indicators can muddy your view, causing confusion instead of clarity. For example, stacking a 14-period RSI with several moving averages and Bollinger Bands all at once can produce conflicting signals, leaving you stuck or second-guessing. Instead, focus on a few indicators that complement each other – perhaps combine trend-following average lines with a momentum oscillator like the RSI. Experiment on demo accounts to find a reliable combo without clutter.
Kenyan markets, especially local stocks or forex pairs with lower liquidity, can be volatile with frequent false breakouts or erratic price swings. This noise can trigger premature alerts and misinterpretation of trends on TradingView. To manage this, rely on confirmation from multiple timeframes. Say you see a breakout on the 15-minute chart; check the hourly or daily chart before committing. Using volume indicators alongside price action can also screen out fake signals. Patience often pays off more than rushing into trades based on a single chart movement.
Always remember: charts reflect past price action, not guaranteed futures. Avoid chasing every move.
Trading is a continuous learning process. Kenyan traders can benefit from local trading forums, WhatsApp groups, and workshops organised in Nairobi and other cities. Platforms like the Nairobi Securities Exchange (NSE) and CMA Kenya offer webinars and guides that deepen understanding of market analysis. Internationally, TradingView itself has an active community publishing trading ideas and tutorials, which you can follow to stay updated on innovative charting approaches. Combine these with reading financial news on Business Daily or The Standard to see how global events affect markets.
Practical use and ongoing learning go hand in hand — sharpen your chart skills gradually, and avoid shortcuts that promise quick profits.
This thoughtful approach to common challenges ensures your TradingView experience stays effective, tailored, and suited to the realities of the Kenyan trading scene.
📊 Master TradingView charts for smarter market moves. Learn to customise, analyse and set alerts tailored for Kenyan traders and investors. Boost your trading skills now!
📈 Discover how to use TradingView.com for market analysis in Kenya. Learn chart tools, customise for local stocks, access on mobile, and explore subscription options.
📈 Discover how DerivTradingView blends Deriv’s platform with TradingView’s charts to boost your market analysis and trading in Kenya. Learn features, costs & tips!
📈 Learn how to add TradingView charts on Deriv for clearer market insights. Step-by-step tips help Kenyan traders boost strategies and navigate tech setup easily.
Based on 13 reviews