

Trading Sessions in Kenyan Time: What Investors Should Know
📈 Know key trading sessions in Kenyan time: Asian, European & American markets. Learn session overlaps, volatility shifts & smart tips for investors in EAT⏰
Edited By
Sophia Reed
Fibonacci retracement levels are key tools traders use to spot likely points where price trends might pause or reverse. Originally drawn from the Fibonacci sequence—a mathematical series where each number is the sum of the two before it—these levels translate into percentages that mark potential support and resistance zones on price charts.
In practical terms, traders in Nairobi or Mombasa watching forex or NSE stocks can apply Fibonacci retracement to identify entry or exit points. For example, if a stock rises from KSh 100 to KSh 150, retracement levels such as 23.6%, 38.2%, and 61.8% indicate price zones between KSh 138.2, KSh 131, and KSh 119.1 where the stock might pull back before resuming its trend.
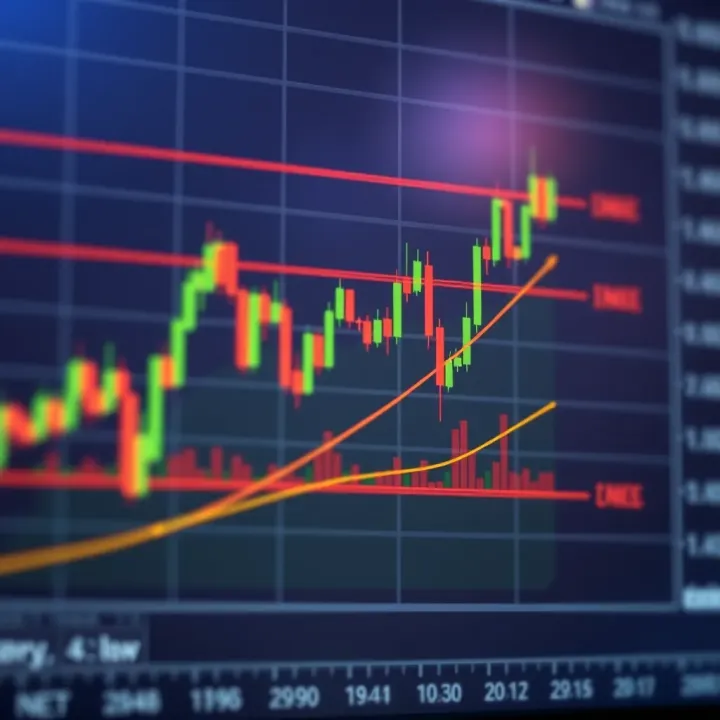
These percentages reflect natural market psychology where prices seldom move in a straight line but instead retrace a portion before continuing. Fibonacci levels help clarify this zig-zag movement so traders can plan their moves rather than guess.
Key point: Fibonacci retracement isn't a crystal ball but a guide highlighting where buyers or sellers might step in based on historical price swings and prevailing trends.
To calculate Fibonacci retracement levels, you simply need two key points on a chart: the lowest and highest prices over a set time. Once these are marked, the various retracement percentages are drawn horizontally to reveal where price corrections could occur.
Typical retracement levels used commonly include 23.6%, 38.2%, 50%, 61.8%, and 78.6%. These levels attract attention because of the underlying Fibonacci ratios, especially the 61.8% "golden ratio," which often signals strong support or resistance.
For Kenyan traders, combining Fibonacci retracement with local market knowledge, like macroeconomic news or CBK interest rate changes, makes the analysis more grounded. It’s one thing to see a retracement zone, but knowing if there’s ongoing political stability or currency shifts contextualises those zones.
Ultimately, understanding Fibonacci retracement levels equips you with a structured framework to interpret price movements. You gain a clearer sense of where price corrections are more likely to stall, helping you to seize better trading opportunities with confidence.
Fibonacci retracement levels form a fundamental tool for traders seeking to understand price movements in markets. They provide clear points where prices tend to pause or reverse during corrective moves. For Kenyan traders working with NSE stocks, forex pairs, or even commodities, grasping these basics helps enhance timing decisions and risk management.
The Fibonacci sequence is a series of numbers starting with 0 and 1, where each subsequent number is the sum of the two before it (0, 1, 1, 2, 3, 5, 8, 13…). This simple pattern appears surprisingly often in nature—like the pattern of leaves on a plant or the spiral of a seashell. In trading, this sequence underpins the calculation of retracement levels, reflecting natural proportions which many believe also influence human behaviour in financial markets.
Retracement levels are horizontal lines that indicate where price might pull back before continuing in the original direction. They are derived by taking key Fibonacci ratios and applying them to the price range of a recent move, whether up or down. For example, if a stock in NSE rises from KSh 100 to KSh 150, a 38.2% retracement level would be around KSh 131 – a possible support point if the price pulls back.
Prices rarely move in a straight line; they tend to advance, retrace a portion of that move, then continue. Fibonacci retracement levels help identify these pause zones where buying or selling pressure may increase. For instance, a forex pair like USD/KES might bounce back after touching a 61.8% retracement level during a downtrend. This offers traders clues on potential entry or exit points, improving trade timing.
These ratios come from relationships found within the Fibonacci sequence. They signify common levels where retracement often occurs. The 50% level, though not a Fibonacci number, is frequently used since markets tend to reverse around the halfway mark. Traders pay special attention to 61.8% — known as the "golden ratio" — as price reactions here often mark strong areas of support or resistance.
Using these levels gives a trader a structured way to gauge possible price reversals or continuation zones. Instead of guessing, a trader can look at these logical price points backed by historical patterns. In Kenya’s volatile markets, especially forex, combining Fibonacci levels with volume or moving averages improves trade confirmation, reducing false signals and helping traders avoid hasty decisions.
Remember, Fibonacci retracement levels do not guarantee a price reversal but instead serve as important reference points within broader market analysis
In summary, understanding these basics equips traders with a simple yet powerful framework to interpret market pullbacks and plan trades wisely. With this foundation, traders on the NSE or forex markets can navigate price swings more confidently and spot opportunities more clearly.
Knowing how to calculate and draw Fibonacci retracement levels is crucial for traders aiming to identify potential price reversal zones. These levels act like road signs on a price chart, signalling where the market might pause or change direction. Drawing them correctly helps you spot support and resistance points, making your trade entries and exits smarter.
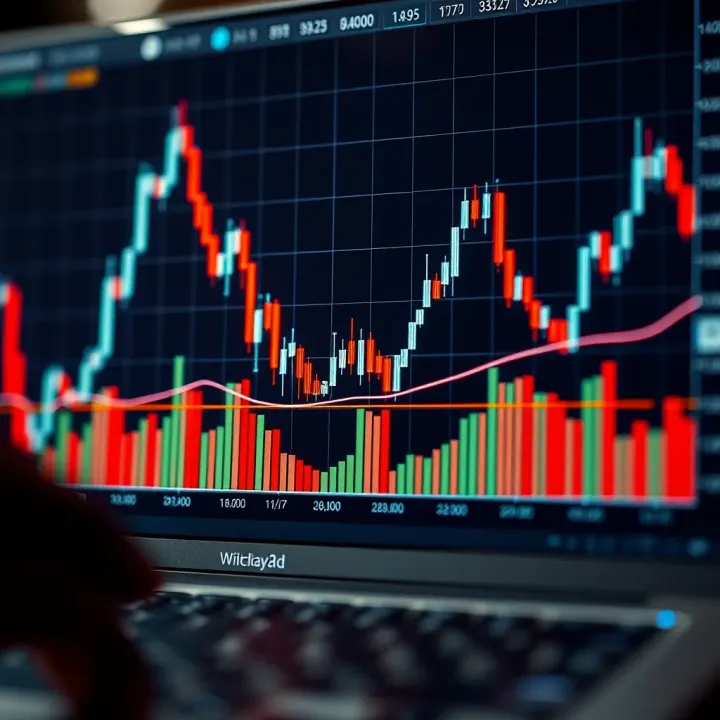
Swing highs and swing lows are key turning points on price charts where the trend temporarily reverses. A swing high forms a peak after an upward move, marking where selling pressure began pushing prices down. Conversely, a swing low is a trough after a price drop, showing where buyers stepped in to push the price up. These points are vital because Fibonacci retracement levels are drawn between them to map probable support or resistance areas.
Choosing the right swing high and low requires looking for prominent and clear pivots rather than minor fluctuations. On a daily chart for NSE stocks, for example, you might pick the highest price of a recent bullish run as the swing high and the lowest point before the rally as the swing low. Picking shallow or insignificant swings may give misleading retracement signals. It's practical to confirm these points by checking volume spikes or candlestick patterns that signal real trend shifts.
Some traders prefer plotting retracement levels manually, using the known Fibonacci ratios applied with a ruler or chart grid, which deepens their understanding of price behaviour around these points. However, most today use software tools like TradingView or Metatrader, which automatically calculate and draw levels once you mark the swing highs and lows. These tools speed up analysis and reduce errors, but relying solely on automation without understanding can lead to misinterpretations.
Suppose a forex trader on Metatrader spots a recent uptrend where EUR/USD moved from 1.0800 to 1.1200. They would click on the 1.0800 swing low and drag the retracement tool up to 1.1200 swing high. The software then marks levels like 23.6%, 38.2%, 50%, and 61.8% between these points. The trader watches how the price reacts near these levels—for example, if it pulls back to 38.2% (around 1.1100) and bounces back up, that confirms a support zone worth considering for a buy entry. This practical approach helps traders make precise decisions based on clearly identified retracement zones.
Drawing Fibonacci retracements carefully, with well-chosen swing points, sharpens your ability to anticipate market moves and manage risk effectively.
In sum, accurately identifying swings and methodically drawing retracement levels using available platforms enhances your technical toolkit. For Kenyan traders, practising this on NSE charts or popular forex pairs can reveal solid opportunities aligned with market rhythms, making your trading more confident and data-driven.
Fibonacci retracement levels offer traders clear points on a chart where price could potentially reverse or pause. Kenyan traders especially can benefit from using these levels to mark likely support and resistance zones, improving entry and exit timing. These levels don’t work alone, though; they should guide decisions alongside other insights, not replace them.
Price movement often shows hesitation around key Fibonacci retracement levels such as 38.2%, 50%, and 61.8%. When the price pulls back during an uptrend, it tends to find support near one of these levels before resuming the upward move. For example, a stock listed on the NSE pulling back to the 61.8% retracement after a sharp rise may bounce back, signalling a buying opportunity.
However, traders must watch how price behaves around these levels. A solid bounce or a cluster of candles with long wicks near a retracement level confirms the zone’s strength as support or resistance. If price cuts through without reaction, it might signal a false level or weak zone.
Recognising valid versus false signals is crucial. True retracement support or resistance is often accompanied by increased trading volume and confirmations from other indicators. False signals appear when price briefly touches a fib level only to break through swiftly without stabilising. For instance, during a volatile forex session, the EUR/USD might pierce the 50% retracement but quickly reverse, showing a false breakout.
Moving averages can validate Fibonacci retracement zones by showing dynamic support or resistance near these levels. For example, if a 50-day moving average coincides with the 38.2% retracement on the NSE stocks, that increases the chance of a solid support zone. Volume also plays a key role—higher volumes near retracement levels suggest stronger conviction by traders.
Candlestick patterns add another layer of confirmation. Engulfing patterns, dojis, or hammer candles forming near retracement lines confirm potential reversals or pauses in price. When a hammer candle appears at the 61.8% retracement level after a downtrend on the Nairobi All Share Index, it hints buyers are stepping in.
Kenyan markets like the NSE and forex pairs exhibit specific volatility patterns. The NSE can be choppy during the day, reflecting local economic news and investor sentiment. Traders should adjust their Fibonacci retracement use to accommodate sudden price spikes or drops, keeping stop-loss orders tight around retracement zones.
Similarly, forex trading offers 24-hour market movement but can be affected by global events like US or European policy decisions. Kenyan traders focusing on forex should apply Fibonacci retracement during key market sessions and combine it with currency-specific news. Adjusting retracement levels based on timeframes used (daily vs hourly) can improve effectiveness.
Combining Fibonacci retracement with volume, moving averages, and candlestick patterns helps Kenyan traders make informed, confident decisions rather than relying on fib levels alone.
In summary, using Fibonacci retracement levels as a guide rather than a standalone tool, especially when paired with other market indicators, improves the chances of spotting profitable trading opportunities in the Kenyan trading environment.
Fibonacci retracement levels are a helpful tool, but they are not foolproof. It's crucial to be aware of their limitations and common errors traders often make. Understanding these can prevent costly mistakes and improve your analysis.
Traders sometimes fixate on Fibonacci levels without paying attention to the bigger market picture. For instance, if the general trend on the Nairobi Securities Exchange (NSE) is strongly bearish due to economic reports or political unrest, relying solely on retracement levels to predict support might lead you astray. The wider trend often trumps isolated signals, so aligning Fibonacci analysis with overall market direction increases its reliability.
Using Fibonacci retracement levels without confirmation from other indicators can create false confidence. Relying solely on these lines might cause premature entry or exit from trades. For example, a retracement level may coincide with a potential support, but if the volume is low or moving averages suggest a different trend, entering a trade just on the retracement could result in losses. It's best to pair Fibonacci with tools like volume analysis or moving averages to filter out weak signals.
Selecting incorrect swing highs or lows distorts Fibonacci levels and misleads your trading decisions. If you pick a minor price fluctuation instead of a clear peak or trough, the retracement lines may fall in irrelevant zones. For example, choosing an insignificant swing during a noisy session on the forex market could cause retracement levels that do not reflect actual market sentiment. Always aim to identify significant swings that capture the main movement of the price.
Look for well-defined swing points where price action clearly reverses direction with strong momentum. In Kenyan equities like Safaricom or Equity Bank shares, watch for daily or weekly chart swing points rather than intraday minor changes. A trick is to zoom out and confirm the swing point on multiple timeframes. This practice helps avoid focusing on market noise or minor price wobbles.
Market noise can cause prices to briefly cross Fibonacci levels causing false breakouts. To reduce being misled, combine retracement signals with volume spikes or candlestick patterns. For example, if price dips below a retracement level but volume remains low, the breakout is less likely to sustain. Using additional confirmation prevents chasing fake moves.
"Patience pays off more than rushed decisions when using Fibonacci retracements in volatile markets."
Waiting for clear confirmation such as price closing beyond a level or forming reversal patterns reduces errors. Rather than jumping into a trade the moment price touches a retracement, observe price behaviour for a few candles or sessions. This is particularly important in Kenya's often-volatile markets, where sudden news can cause sharp but short-lived price swings. By practising patience and seeking confirmation, you save yourself from false signals and unnecessary losses.
This section aims to equip you with practical warnings on overuse, selecting proper data, and reading the market temper. Keep these limitations in mind to refine your use of Fibonacci retracement levels and boost your trading confidence in Kenyan markets.
Access to the right resources and tools is key for anyone looking to use Fibonacci retracement levels effectively in Kenyan markets. Given the unique trading environment here—whether on the Nairobi Securities Exchange (NSE) or in forex markets—having reliable charting platforms and educational supports can make a big difference. This section highlights practical options and communities that can help you sharpen your trading skills.
Metatrader and TradingView are among the most popular platforms Kenyan traders use to analyse price movements and draw Fibonacci retracement levels. Metatrader, especially Metatrader 4 and 5, is widely adopted because local brokers often provide direct integration, allowing seamless order execution alongside technical analysis. TradingView, on the other hand, offers browser-based charts with rich visual features which enable traders to overlay Fibonacci levels smoothly, ideal for those without heavy software setups.
Local brokers also provide their own software or web applications equipped with familiar tools adapted to Kenya’s trading style and schedules. These platforms often include real-time price data on NSE shares, forex pairs, and commodities, making them very handy for on-the-go decision-making.
Features supporting Fibonacci tools are crucial in these platforms. Auto-drawing tools speed up the process of identifying swing highs and lows, while customisable levels let traders adjust ratios based on their strategy. For example, TradingView allows you to save Fibonacci templates which you can apply repeatedly across different charts, saving time and maintaining consistent analysis. Metatrader also supports third-party Fibonacci indicator plugins that enhance signal accuracy by combining retracement with other metrics like trend strength or volume.
Learning where to find solid educational materials on Fibonacci strategies is important. Several Kenyan online trading academies and webinar series offer specialised courses focusing on technical analysis, including Fibonacci retracement. These resources break down the concepts into practical steps tailored for local market conditions. Besides paid courses, many brokers host free tutorials explaining how Fibonacci levels can be combined with local market news and NSE indices behaviour for better trade timing.
Active Kenyan online trading forums and groups provide a platform for daily discussion and experience sharing. Communities on social media platforms and WhatsApp groups often analyse current charts and discuss retracement signals in real time. For instance, traders from Nairobi and Mombasa frequently exchange ideas on how local economic reports influence support and resistance levels identified by Fibonacci tools. Engaging with these groups can give you access to trading tips grounded in on-the-ground realities, helping you avoid common pitfalls and spot opportunities earlier.
Using the right tools and connecting with knowledgeable peers enhances your ability to read charts correctly and make informed trades, especially in Kenya’s dynamic trading scene.
Together, well-chosen platforms and vibrant local communities form the backbone of effective Fibonacci retracement use for Kenyan traders. Make sure to regularly update your software and stay tuned to community insights to keep your trading edge sharp.
📈 Know key trading sessions in Kenyan time: Asian, European & American markets. Learn session overlaps, volatility shifts & smart tips for investors in EAT⏰
📈 Learn how to trade online confidently with practical tips for Kenyan investors—covering safe platforms, risk management, legal rules, and growing your KSh wisely.
📈 Master trading charts with this practical guide for Kenyan investors. Learn to read price movements, use key indicators, and avoid common mistakes in local markets.

📈 Learn how to trade and grow your savings in Kenya. Discover easy market choices, smart platforms, risk tips, and useful tools to start trading wisely today.
Based on 14 reviews